Dashboard
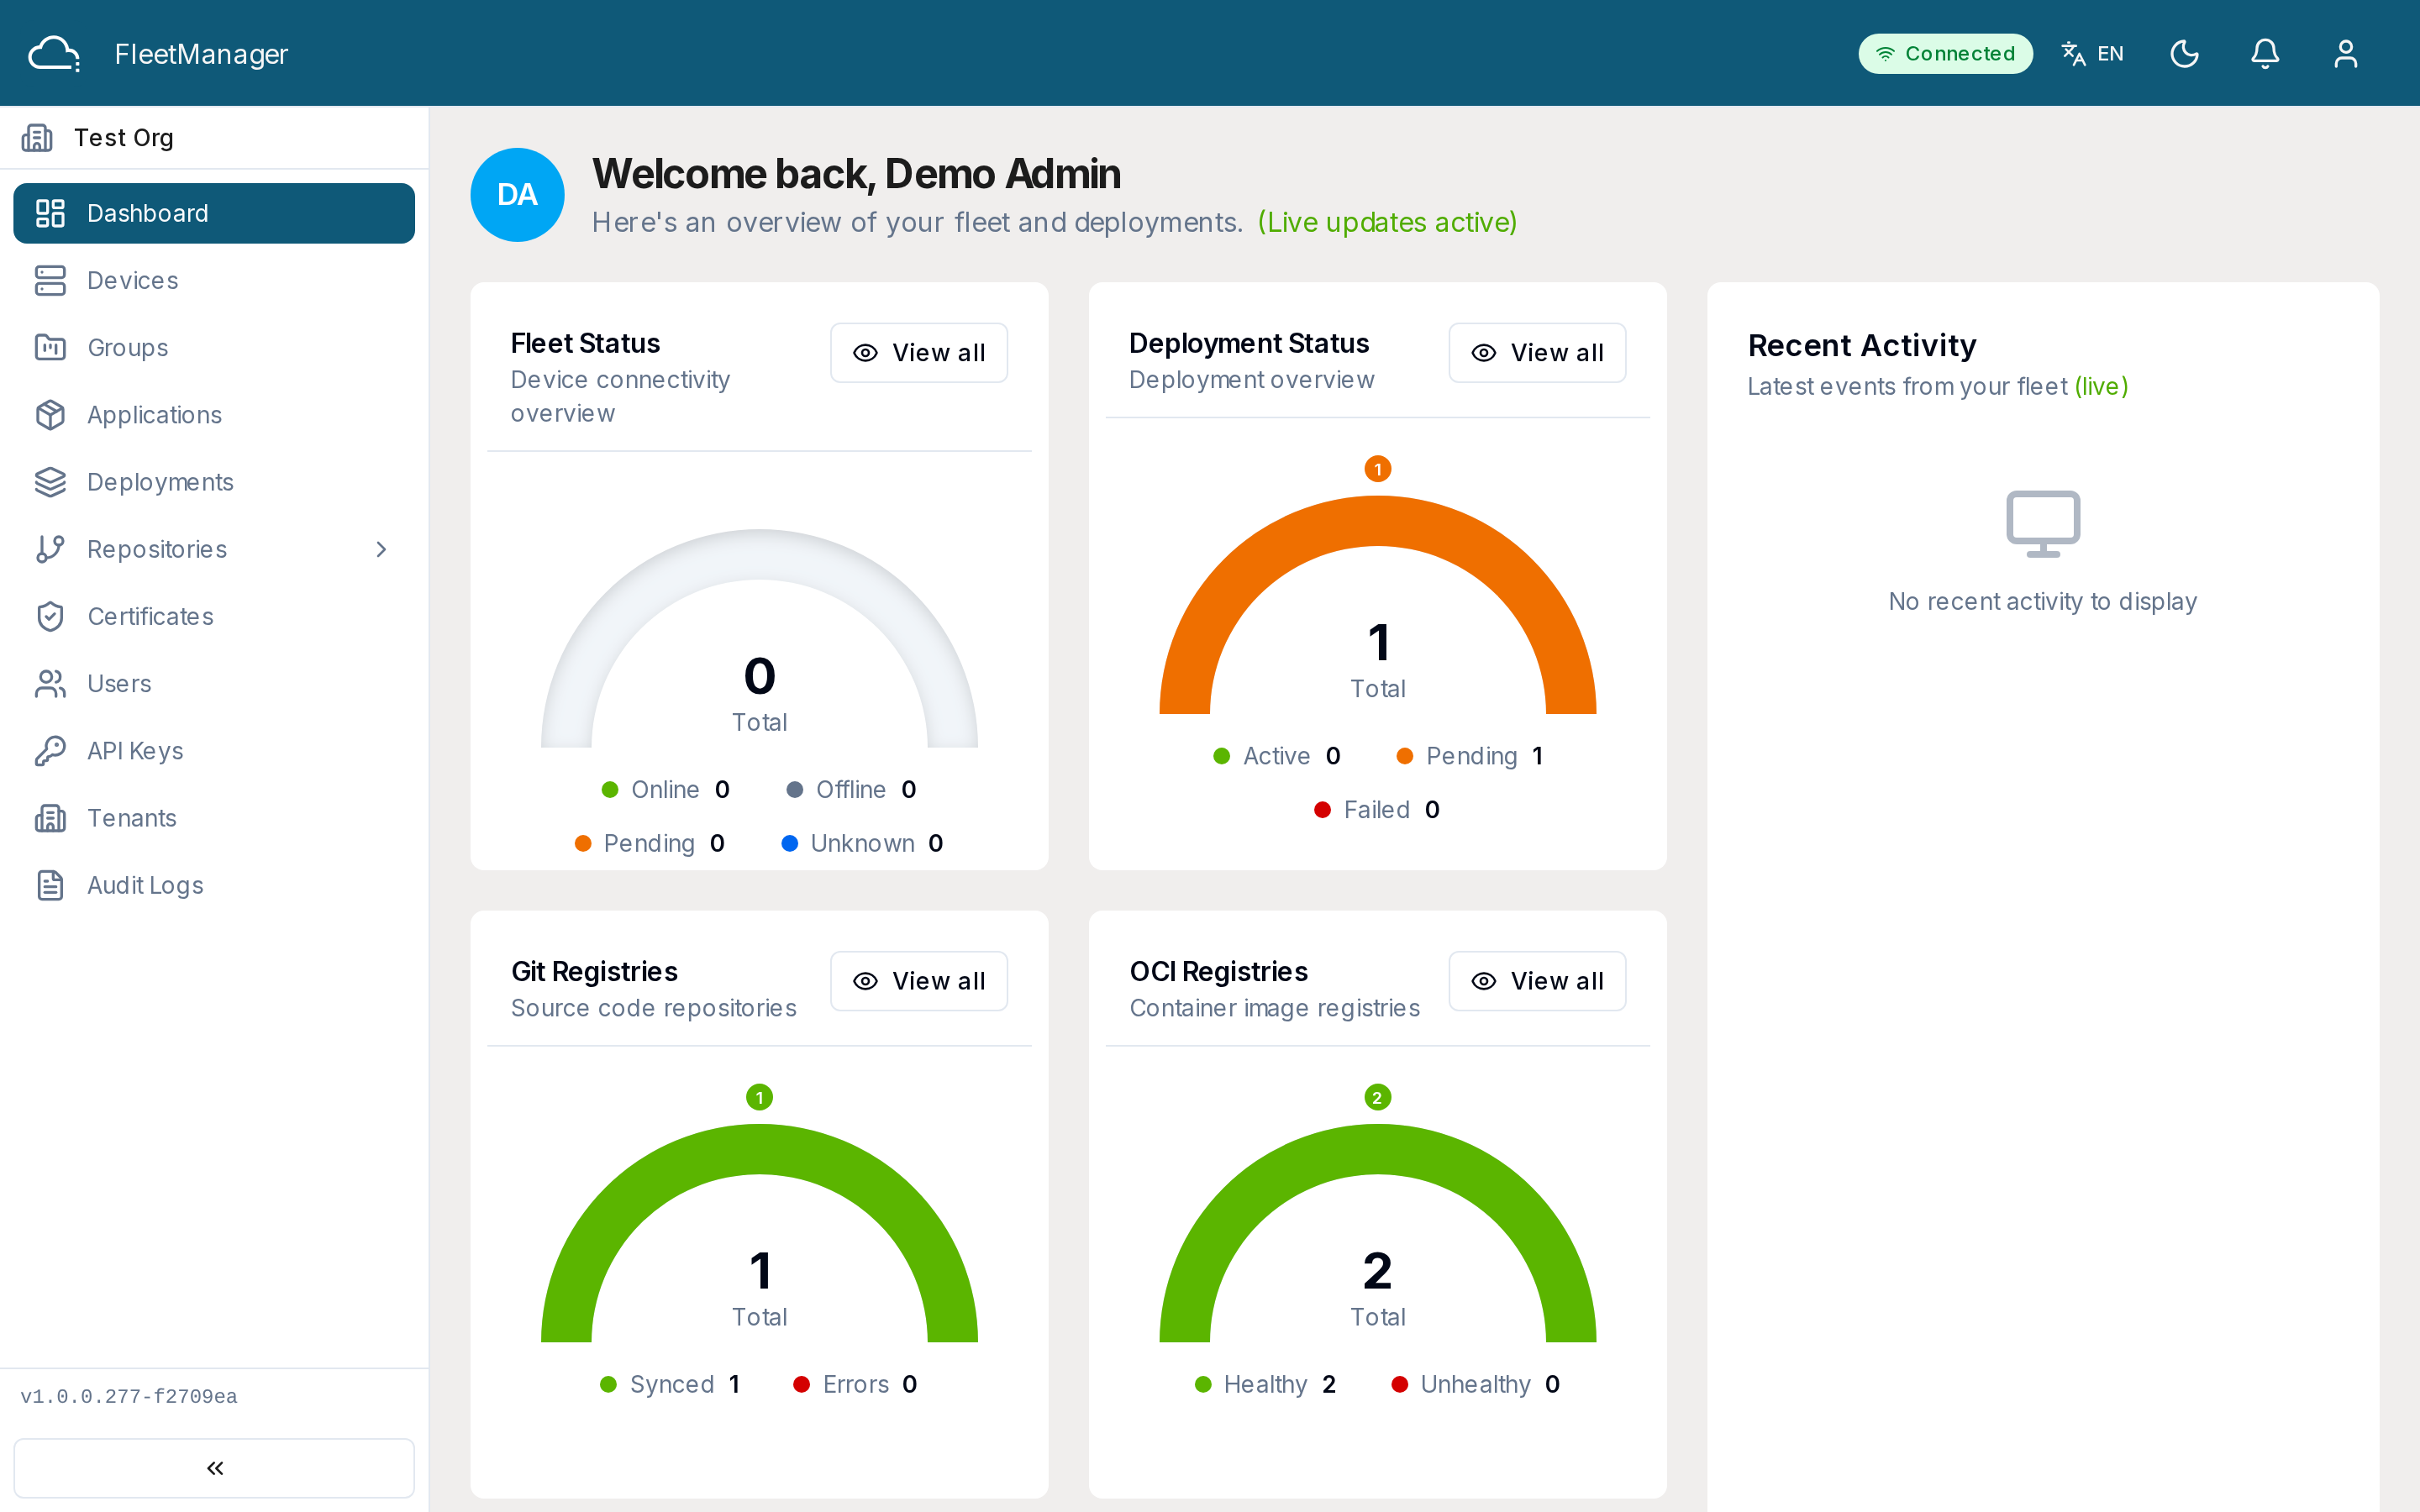
The Dashboard is the landing page after you sign in. It gives an at-a-glance view of your tenant’s health and a live feed of what’s happening.
Who can access this: all roles.
What you see
Section titled “What you see”A grid of status cards:
- Fleet Status — device counts by state (online, offline, pending, unknown, error).
- Deployment Status — deployment counts (total, active, pending, failed).
- Git Registry Status — Git repository sync health and error count.
- OCI Registry Status — container registry health.
- Certificate Status — certificates by expiry (valid, expiring, expired).
- Fleet Health — telemetry-based health metrics.
Alongside, the Recent Activity timeline streams the most recent events — devices coming online/offline, deployments starting, completing, or failing, and applications being installed or updated. It updates in real time.
Using the Dashboard
Section titled “Using the Dashboard”- The page auto-refreshes (about every 30 seconds). A live indicator shows the real-time connection status.
- Use the refresh button to update immediately, or toggle auto-refresh off.
- Click through a status card to the matching module (for example, Fleet Status → Devices) to act on what you see.
Status values
Section titled “Status values”- Devices: online, offline, pending, unknown, error.
- Deployments: pending, installing, installed, failed, removing, removed.
- Certificates: valid, expiring, expired.